ALAA ZAITOON
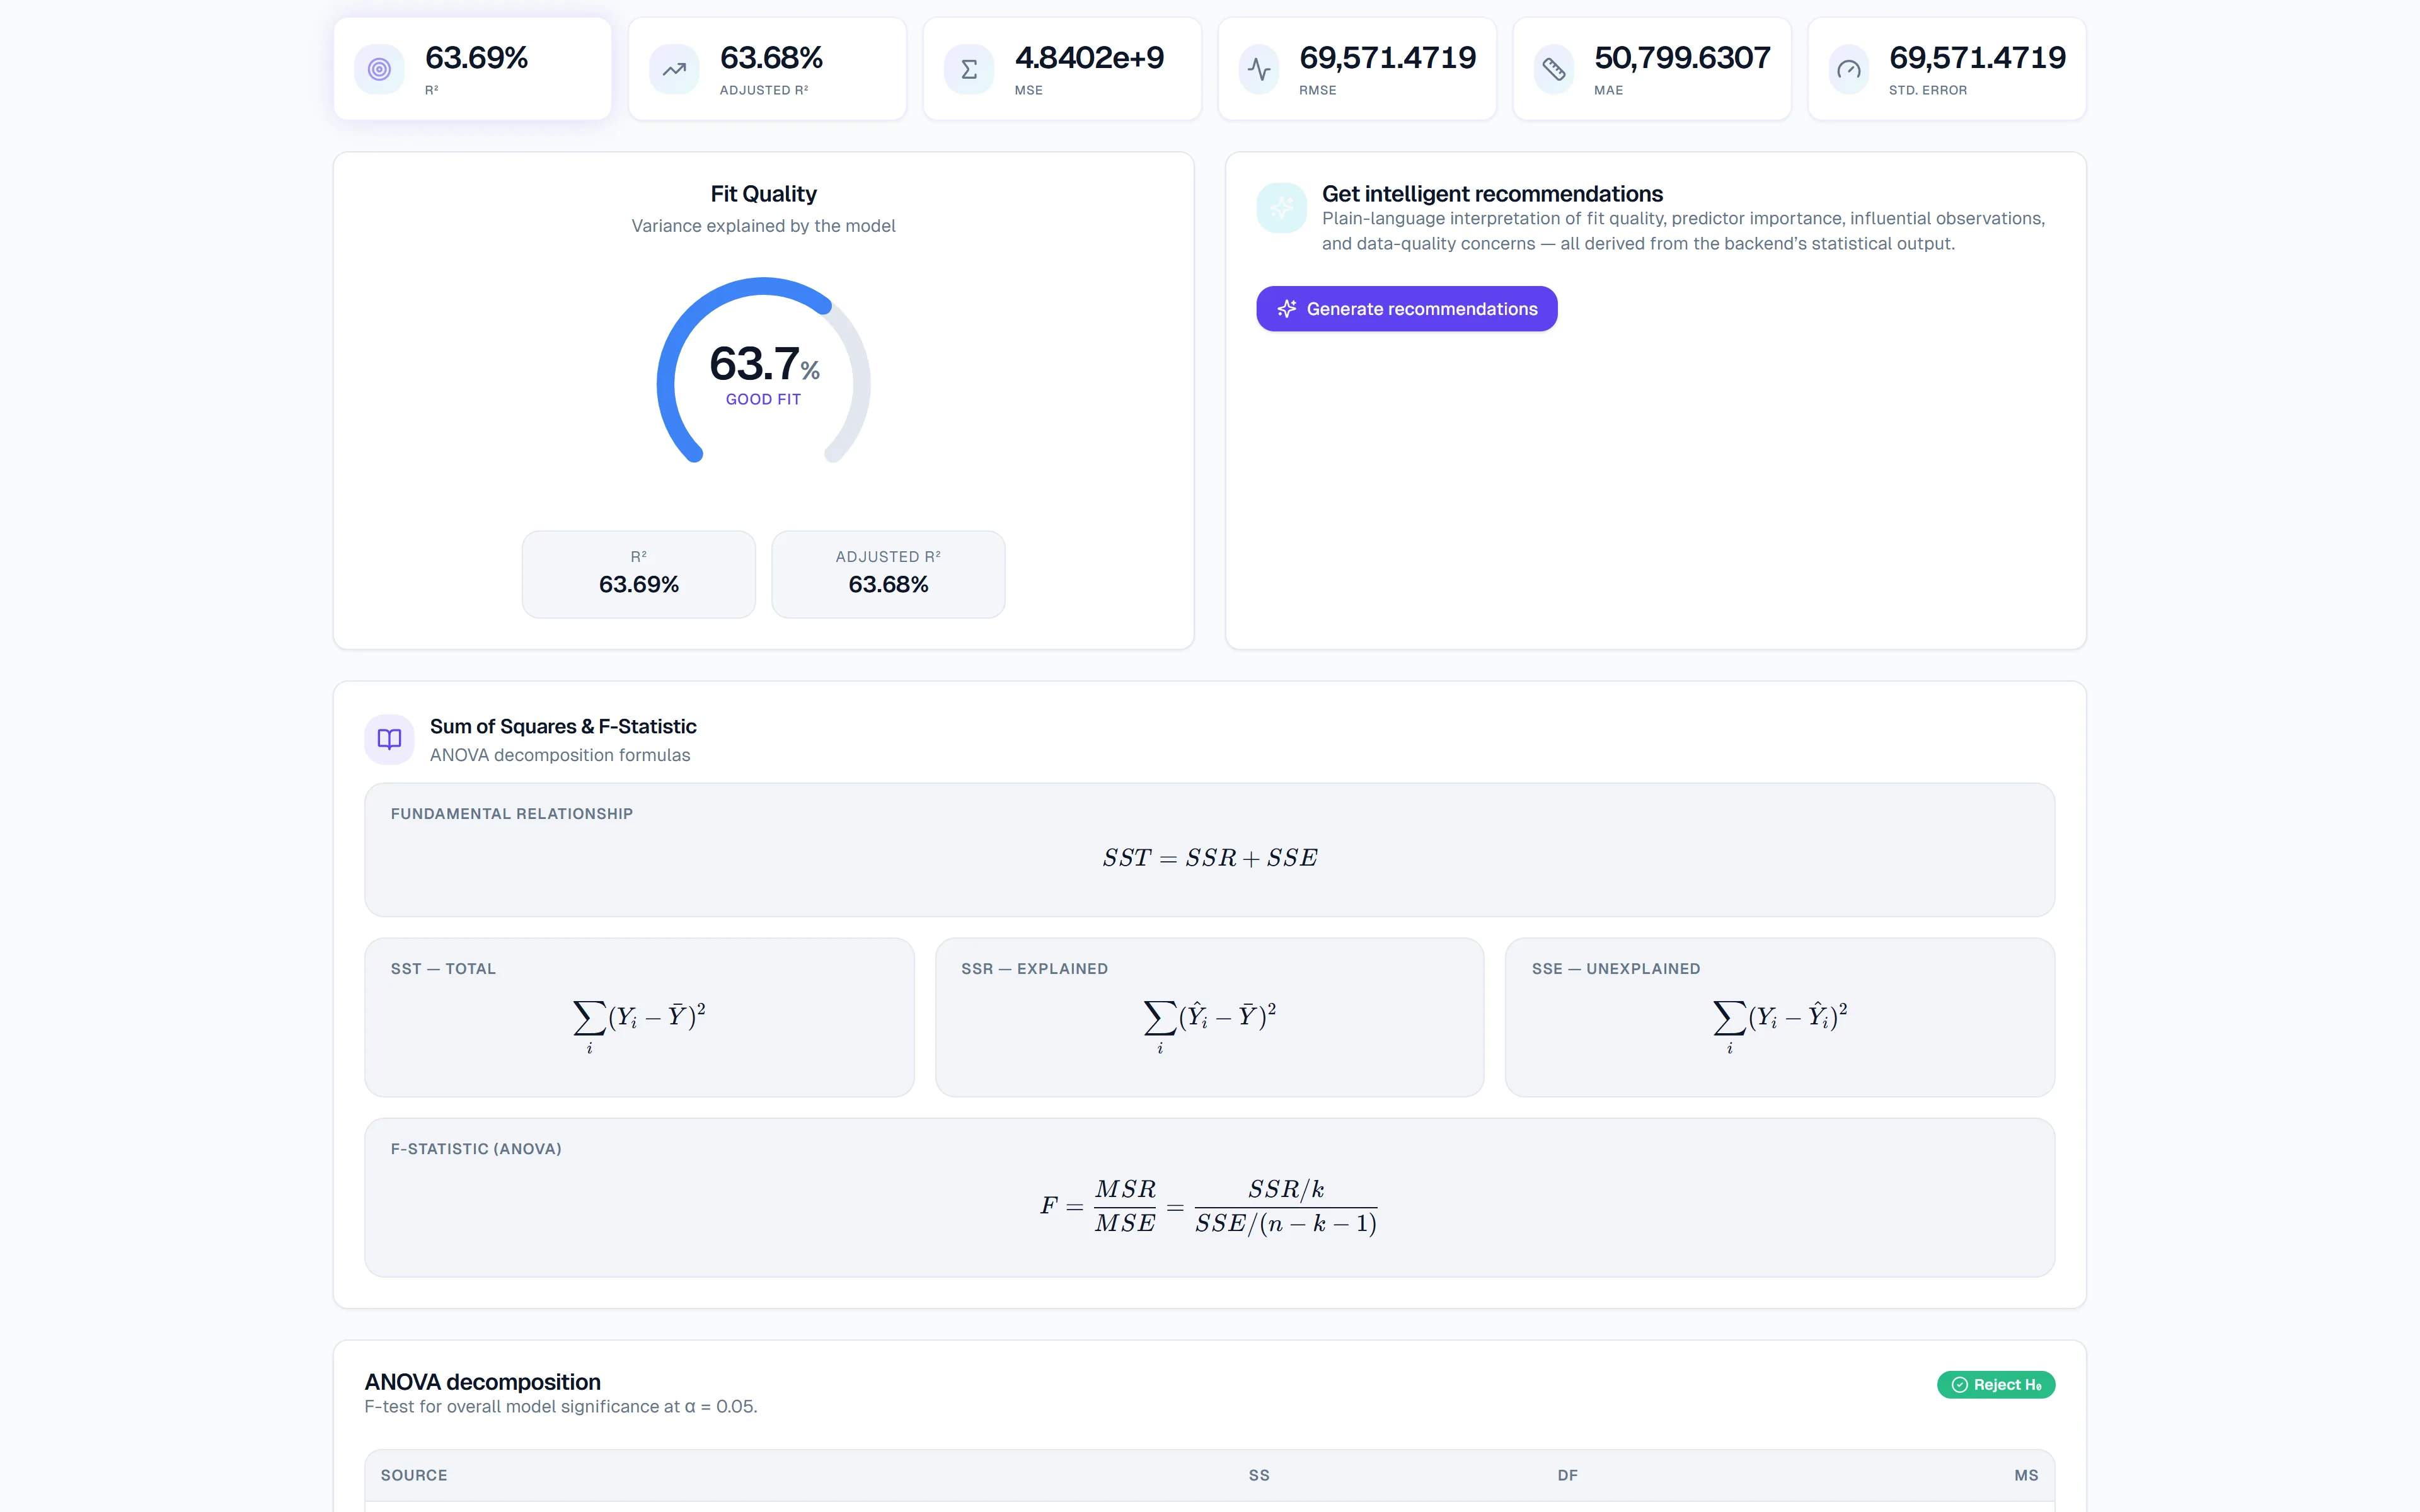
A production-grade statistical inference and regression dashboard. Driven by a FastAPI backend acting as the single source of mathematical truth, it handles closed-form Ordinary Least Squares, full ANOVA decomposition, t-tests, standard errors, and Cook's distance for influence detection, complete with client-side interactive ECharts and dynamic server-generated PDF reporting.
Traditional statistical analysis tools are either overly complex desktop software or lack modern interactive visual feedback. Users need a streamlined web platform to upload datasets, configure variables, and run linear regression with instant visual and mathematical validation.
A decoupled architecture using a high-performance FastAPI backend for complex statistical math (OLS, ANOVA, p-values) acting as the single source of truth, and a Next.js frontend rendering dynamic charts using Apache ECharts. Reports are generated dynamically using ReportLab in Python.
Handling numerical stability during closed-form OLS matrix inversions with highly collinear data, and optimizing dynamic PDF generation to align mathematical notations correctly under pressure.